Step 4: View Pre-Optimized Timing Analysis Results

After you compile the largefilter design, you can view the speed performance in the fmax section of the Compilation Report.

To view the pre-optimized speed performance of the largefilter top-level design, follow these steps:

  1. In the left pane of the Compilation Report window, click the + icon to expand the Timing Analyses folder.

  2. Under the Timing Analyses folder, select the fmax section. The fmax section displays the worst-case speed performance of the design. The fmax section displays performance results in red, indicating that the specified fMAX requirement was not achieved in the design. Note that all performance violations are related to the multiplier operators in the design.
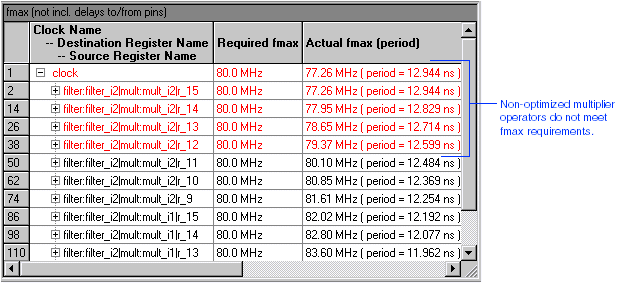
  3. Show Me
    Non-Optimized Performance Results

    Non-Optimized Performance Results

The following tutorial sections describe how to use the LogicLock feature to optimize the multiplier operators and achieve performance goals.


To continue the tutorial, proceed to Step 5: View Fitting Results in the Floorplan.