The Tera MTA is a revolutionary commercial computer based on a multithreaded processor architecture. In contrast to many other parallel architectures, the Tera MTA can effectively use high amounts of parallelism on a single processor. By running multiple threads on a single processor, it can tolerate memory latency and to keep the processor saturated. If the computation is sufficiently large, it can benefit from running on multiple processors. A primary architectural goal of the MTA is that it provide scalable performance over multiple processors. This paper is a preliminary investigation of the first multi-processor Tera MTA.
In a previous paper [1] we reported that on the kernel NAS 2 benchmarks [2], a single-processor MTA system running at the architected clock speed would be similar in performance to a single processor of the Cray T90. We found that the compilers of both machines were able to find the necessary threads or vector operations, after making standard changes to the random number generator. In this paper we update the single-processor results in two ways: we use only actual clock speeds, and we report improvements given by further tuning of the MTA codes.
We then investigate the performance of the best single-processor codes when run on a two-processor MTA, making no further tuning effort. The parallel efficiency of the codes range from 77% to 99%. An analysis shows that the "serial bottlenecks" -- unparallelized code sections and the cost of allocating and freeing the parallel hardware resources -- account for less than a percent of the runtimes. Thus, Amdahl's Law needn't take effect on the NAS benchmarks until there are hundreds of processors running thousands of threads.
Instead, the major source of inefficiency appears to be an imperfect network connecting the processors to the memory. Ideally, the network can support one memory reference per instruction. The current hardware has defects that reduce the throughput to about 85% of this rate. Except for the EP benchmark, the tuned codes issue memory references at nearly the peak rate of one per instruction. Consequently, the network can support the memory references issued by one, but not two, processors. As a result, the parallel efficiency of EP is near-perfect, but the others are reduced accordingly.
Another reason for imperfect speedup pertains to the compiler. While the definition of a thread in a single processor or multi-processor mode is essentially the same, there is a different implementation and an associated overhead with running on multiple processors. We characterize the overhead of running "frays" (a collection of threads running on a single processor) and "crews" (a collection of frays, one per processor.)
Keywords: Tera multithreaded architecture, performance evaluation, NAS parallel benchmarks, scalability analysis, performance tuning, parallelizing compilers.
The MTA uses a 3-wide instruction (VLIW) encoding 3 operations. Each cycle, an instruction can issue one memory reference and two other operations. The compiler annotates each instruction with a lookahead number. The lookahead is the number of subsequent instructions from the same stream that can be executed before the memory reference of the current instruction must be completed. A lookahead of 0 means that the next instruction needs the current memory reference and cannot be executed until it has completed. If lookahead were always 5, about 30 streams would suffice to saturate the processor. Fortunately, scientific codes exhibit a high level of ILP. The compiler effectively uses software pipelining to schedule the memory reference ahead of the uses, and it often achieves the maximum lookahead of 7 on the NAS kernel benchmarks.
The clock rate of our MTA is 255 MHz. Because each VLIW instruction can include a fused multiply-add operation and another (unfused) floating-point operation, the MTA is theoretically capable of over three quarters of a GFLOP/sec per processor. However, the limitation of only one memory reference per cycle, and the need to do indexing calculations, prevents this level of performance from being achievable on any but artificial codes.
The Tera MTA comes with a sophisticated compiler that automatically parallelizes serial code by decomposing it into threads. The compiler attempts to determine statically how much parallelism is available in a piece of computation (for example a loop) and decomposes it into a number of threads sufficient to saturate the hardware. While the results of such automatic parallelization are often satisfactory, the programmer may wish to "look under the hood" to see how the compiler has decomposed the computation. The feedback loop whereby the programmer observes the choices that the compiler has made and influences it to make different choices (due to the programmer's deeper understanding of the dynamic computation and/or the resources available) can lead to improved performance.
Tera provides two powerful tools that allow the programmer to profile performance and to understand how the compiler has structured computation. When a program is compiled with tracing enabled, an execution trace is created at runtime which can be viewed post-mortem via a graphical tool called Traceview. Traceview gives a clear idea of how well the executable uses the available hardware. If the programmer wishes to see how the program has been decomposed into threads and targeted to the hardware, a tool called Canal provides an annotated version of the source file which reveals this information. The use of these tools will be illustrated.
In [1] we extrapolated the performance of a one processor MTA prototype, which ran at 145 MHz, to 333 MHz and compared that performance to a single processor of the T90. In [3] we updated these results and present one- and two-processor results on three full application codes. Subsequently, we have made further improvements to the NAS kernel benchmarks. The performance of the previous and current versions are shown in table and graphical form below.
|
Benchmark |
T90 Vanilla |
MTA | ||
|
Vanilla |
Best from [3] |
Current best |
||
|
CG (MFLOP/S) |
176 |
142 |
158 |
178 |
|
FT (MFLOP/S) |
177 |
39.2 |
138 |
199 |
|
IS (MOP/S) |
62 |
61.6 |
72.1 |
103 |
|
EP (MOP/S) |
7.51 |
4.27 |
7.60 |
7.72 |
|
MG (MFLOP/S) |
519 |
160 |
160 |
237 |
Table 1: Single-processor performance
By the "vanilla" benchmarks, we mean the versions provided by NAS for CG, FT, IS and MG, and a modified EP that has a parallelized (for the MTA) or vectorized (for the T90) random number generator. In Figure 1 the line at "1" on the y-axis represents the performance of one processor of SDSC's 14-processor Cray T90 vector supercomputer. This computer has a much faster clock (440 MHz) than the Tera MTA (255 MHz), and the T90 is able to perform multiple memory operations per cycle. On the vanilla versions of CG and IS, the MTA is able to compensate for these handicaps. As we will describe later, FT required "de-optimizing" code that was intended to benefit cache-based processors, and EP benefited from simple inlining of procedure calls. The final code, MG, is limited in performance by the memory bandwidth, for which the T90 has an unbeatable advantage.
It should be noted that we did not optimize the T90 code beyond ensuring that the important inner loops are vectorized. The T90 performance could undoubtedly be improved; however, we believe that since the vanilla codes were written in style suitable for vector machines, the improvements would not be as great as for the MTA.
Below we describe the tuning effort for each benchmark on the MTA.
do j=1, lastrow-firstrow+1
sum = 0.d0
do k = rowstr(j), rowstr(j+1)-1
sum = sum + a(k)*p(colidx(k))
enddo
w(j) = sum
enddo
This doubly nested loop is parallelizable at the outer level (which the MTA prefers to inner loop parallelism [4]). The computation in the inner loop requires 2 flops and 3 memory accesses. If we recall than the MTA can issue at most one memory access per cycle, we observe that, even with pipelining and prefetching, the MTA will be able to get at most 2 flops every 3 instructions on this code. In fact, the compiler does generate tight code which achieves a high percentage of this upper bound [1]. A "heroic" tuning effort can, as we previously reported, break through the 2/3 flop per cycle by bit packing colidx. Bit packing involves packing several values, each requiring fewer than 64 bits, into a single 64 bit word. In this case three values of colidx can be packed in a single word. This allows for three-fold unrolling of the inner loop with 7 memory references. (Note that 3 iterations of the inner loop would require 9 memory references without bit packing.) The optimized code achieves 6/7 flop per instruction.
The Canal tool, applied to the compiled object, outputs an annotated version of the source which allows the programmer to verify the number of instructions used by the compiler to carry out the computation and to see how many streams will be allocated at runtime. Here is Canal output for the loop above;
Loop 27 in conj_grad_ at line 724 in loop 26
Loop scheduled: 3 memory operations, 2 floating point operations
3 instructions, needs 25 streams for full utilization
The Tera compiler, while powerful, is not infallible. Examining the Canal output can help the programmer determine, for instance, whether the operations are packed into the VLIW instructions as tightly as they could theoretically be. If not, the computation may be restructured to coax the compiler to "get it right." We required several rounds of trial-and-error to get the desired 7-instruction loop for the bit-packed code.
Even when the instruction stream is packed tightly, performance could be lower than expected. Recall that the compiler estimates the number of streams required to saturate the processor. (In the example above, it estimated that 25 streams would suffice, which turned out not to be true.) If the programmer suspects that the processor has not been kept saturated, the program can be recompiled with a -trace flag and rerun to generate an execution trace viewable post-mortem. Figure 2 shows a graphical representation from the Traceview tool applied to a run of CG on two processors.
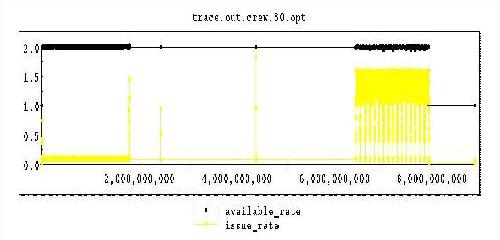
The horizontal axis represents runtime in clock cycles ("tics"). The vertical axis represents available issue slots and the yellow curve shows the utilization of these issue slots by CG. The 1.0 level would represent full utilization of the available issue slots on one processor. The 2.0 level represents full utilization of two processors. As can be seen, CG runs almost purely serial at first. This is all setup which is untimed in the benchmark. We made no effort to parallelize the untimed portion. The yellow block at the right hand end of the graph shows the execution "going parallel"; this is the timed portion of the benchmark. CG is using about 1.7 of the available issue slots on two processors. Interestingly, the one processor version uses about 95%. The difference is largely due to the imperfect network.
If Traceview shows disappointing utilization in a timed section, we can zoom in an area of interest and locate the source code of the problem area. If the problem area is narrowed down to a particular loop, we would consult the Canal output again to see what mix of floating point operations and memory operations made up the loop. We could also see if, in our estimation, the compiler had allocated enough streams for the loop. To try more streams we can insert a pragma in the source code to convince the compiler to ask for more streams. Iterating in this way allows the programmer to improve code in a guided fashion with a clear picture of what the compiler and hardware are doing in response to the code.
The improvements between the earlier and current versions of CG are mainly due to using directives to allocate more streams per processor than the compiler thought necessary. There was also a minor improvement achieved by directing it to allocating chunks of work at a coarses granularity -- 5 rows of the matrix at once rather than one at a time.
The NAS serial code copies a set of 1-D FFT's (the number is a parameter in a configuration file) to contiguous storage. This is done to increase spatial data locality and to remove associativity problems, which are notorious on the FFT with its large power-of-2 strides. The inner loop iterates over the 1-D FFT's providing reuse of the twiddle factors and spatial data locality. This data locality provided by the copying obscures the inherent parallelism.
For the MTA though, data locality is not a concern, but exposing parallelism is of paramount important. Thus to tune FT for the MTA the code was "un-optimized", in the sense that we went back to a more intuitive notion of how to perform the 3D FFT. We eliminated all copies to temporary storage and the computation is done over the 3D grid (even though this involved large power-of-2 strides). We also moved the 1-D FFT's to the outermost loop for each dimension of the 3D FFT; yielding approximately N^2 degrees of parallelism (The parallelism depends on which dimension is being FFT'ed. For the "Class A" size problem, it is at least 128*256 = 32,768-way parallelism).
The 1-D FFT's are implemented using a combination of the Stockham variant 1 and variant 2 algorithm (as described in [5]). The original NAS code only used the second variant, but the second variant has the problem that the first few iterations have short inner loops. Our code employed a method similar to that in the NAS 1 FT where the first variant is done for two iterations and then the second variant is done for the rest of the code. Thus the smallest inner loop consists of doing at least four butterflies.
Furthermore while doing the first variant we do both stages at a the same time, thereby reducing load/stores. As it turns out, the addressing necessary to write the data into the correct location at the end of the second stage is straightforward and this allows us to switch from the first to the second variant without performing a transpose.
Other changes to the code included parallelizing the time-consuming loop in compute_initial_conditions, and constructing two distinct procedures for the FFT and inverse FFT. This is done to prevent conditional branches checking if the conjugate of the twiddle factors need to be computed.
EP (Embarrassingly Parallel) is perfectly parallel at the outer loop level. As mentioned earlier, it was necessary to change the random number generator to remove it as a sequential bottleneck. Most of the time in EP is spent generating the random numbers and in library routines for square root and log. The improvement in EP's running time was due to inlining these library routines.
Unlike the other kernel benchmarks, EP does not have a high percentage of memory references per instructions, so its parallel efficiency is not affected by the suboptimal network.
MG provides another instance of the burden of legacy code. Profiling quickly directed us to four routines: resid, psinv, interp, and comm1p. Together, these routines comprised roughly 70 percent of the execution time. Studying these routines, a pattern became apparent: MG was expressly optimized for vector performance.
The first three share a similar structure. Each consists of a three-deep loop nest, where the inner loop has been split into two loops. A temporary array holds the values between the two inner loops. Each of these two loops vectorizes perfectly. However, both loops perform suboptimally on the MTA and superscalar workstations, since they suffer from a high communication to computation ratio (i.e. they perform many load/store operations for each add/multiply operation). We remedied this problems by a three-step optimization: eliminate the temporary array, then fuse the two loops, and finally skew and tile the resulting single inner loop. Tiling and eliminating the temporary array decrease the communication to computation ratio. Tiling and fusing increase instruction level parallelism.
The fourth, comm1p, had a different structure. comm1p changes the grid resolution in the computation. Doing so involves only copying of data from one array to another. For historical reasons probably reflecting the MPI heritage of the code, the vanilla implementation breaks this simple copy operation into four stages. As with the other routines, the implementors introduced extra arrays to buffer between these stages. While, each of the stages vectorizes perfectly, the resulting computation involves many more memory operations than are necessary. We coded an optimized version of comm1p to perform only the simple array-to-array copy.
Figure 3 shows the results of running our most highly-tuned versions of each NAS 2.3 kernel benchmark on one and two processors of the MTA. "Parallel Efficiency" is defined in Section 5. Results are reported for the MTA at San Diego and the MTA belonging to Tera in Seattle. To enable the benchmarks to run on two processors, it was only necessary, in all cases, to recompile the unmodified source file with the appropriate compiler flags. All runs are for Class A of the benchmarks, the smallest supercomputer class size.
The primary cause of sublinear speedup for these benchmarks is insufficient memory bandwidth. For both MTA's, at the time of writing this paper, the networks connecting the processors to memory have less bandwidth than specified in the design due to defective links in the networks. The Seattle two-processor machine's network is estimated to be about 85% of full bandwidth. This means it can support two processors each issuing a memory reference on about 85% of their cycles, or one processor issuing a memory reference at the maximum rate of one memory reference per cycle. The San Diego machine's network has still lower bandwidth.
EP is not a memory intensive code and so scales linearly. Each of the other benchmarks are highly memory intensive and need more memory bandwidth than provided by either machine. All but FT run faster on the machine with more bandwidth. At the time of writing, we do not understand FT's performance completely, but it may be related to compiler or library differences at the two sites.
We will measure times in cycles. The quantity then P*T(P) represents all the cycles issued by all processors during a parallel execution. Our goal is to classify these cycles into those that represent efficient parallel execution plus those that represent (different types of) overhead. The simplest breakdown is given by the identity
We will give a more detailed breakdown, guided by a more detailed understanding of the MTA. Wherever the compiler is unable to find parallelism, it generates "serial code" with only one thread of execution. Otherwise, it generates threaded code. Rather than statically allocating streams once per program, the Tera compiler generates code that allocates streams only for the duration of a parallel region. This ensures that if multiple jobs are running simultaneously, there will not be idle streams allocated to one job that could be used by another. However, it does incur extra overhead, overhead that might be considered unnecessary when (as in our experiments) only one job is running.
Threaded code comes in two varieties: if the compiler is generating threads for a single processor, it can generate low-overhead "fray code"; otherwise, it generates "crew code" that can use streams on multiple processors. The overhead of allocating streams for a parallel region is about 8500 cycles for fray code, 25,500 cycles for crew code on one processor, and 32,000 cycles per processor (64,000 total cycles) for crew code on two processors [6].
Whenever the MTA is executing sequential code on one processor, the cycles on the remaining (P-1) processors will be wasted overhead. Thus, we can define:
Another source of parallel overhead is the difference between 8500 cycles for allocating streams in fray code (used in the one-processor times), versus the 64,000 cycles for crew code. This gives:
In another set of experiments, we tried running crew code on a single processor. We found that the crew code was slower by more than the extra allocation overhead (25,500-8500 cycles) per parallel region. A possible explanation is that, when generating crew code, the compiler sometimes uses a different method of distributing loop iterations to processors (it can use block, block-cyclic, or dynamic distribution). To reflect this difference, we define:
Finally, we define
The result of this analysis is shown in the table below. The efficiency reported here differs from that shown in Figure 3 since these experiments used instrumented versions of codes that preceeded some of the final tuning efforts.
|
Benchmark |
Parallel Efficiency |
Serial Overhead |
Allocation Overhead |
Crew Overhead |
Other Overhead |
|
CG |
78.82% |
0.23% |
1.58% |
2.05% |
17.33% |
|
FT |
74.59 |
0.04 |
0.04 |
4.84 |
20.50 |
|
IS |
79.37 |
0.71 |
0.30 |
0.44 |
19.18 |
|
EP |
99.26 |
0.00 |
0.00 |
0.03 |
0.71 |
|
MG |
84.04 |
0.22 |
1.02 |
1.45 |
13.28 |
Table 2: Classification of Parallel Cycles