Step 2: View Optimized Timing Analysis Results
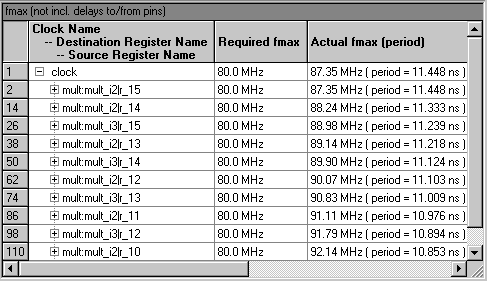
After you compile the filter design, you can view the speed performance in the fmax section of the Compilation Report.
To view the speed performance of the optimized filter design, follow these steps:
-
In the left pane of the Compilation Report window, click the + icon to expand the Timing Analyses folder.
-
Under the Timing Analyses folder, select the fmax section. The fMAX information appears in a table. The fmax section displays the performance information in black, indicating that the specified fMAX requirement was achieved in the design.
Show Me

The final tutorial sections describe how to import LogicLock constraints to preserve this optimized performance in the top-level design.
